- Porter's Daily Journal
- Posts
- Why, and How, You Should Be Raising Cash...
Why, and How, You Should Be Raising Cash...
Porter's Journal Issue #29, Volume #1

And What to Do With It When You Do
This is Porter & Co.'s free daily e-letter. Paid-up members can access their subscriber materials, including our latest recommendations and our “3 Best Buys” for our different portfolios, by going here.
Table of Contents
Three Things You Need To Know Now:
1. Inflation is far from dead. October’s CPI reading of 2.6% released this morning is up from September’s 2.4%. Worse, core inflation – excluding energy and food – was up 3.3%. It’s increasingly looking like a rerun of the cut-too-soon 1970s – when the Fed chairman, under pressure from President Richard Nixon, cut rates prematurely, only for inflation to come roaring back. Still, right now the market is pricing in an 82% chance of another 25 basis point rate cut at the Fed’s next meeting in December. The best ways to protect yourself against inflation? Bitcoin (which is hitting all-time highs) and gold. (And, right now, gold miners… I recently sat down with Marin Katusa, a top gold analyst, to talk about this, and the conversation is well worth listening to.)

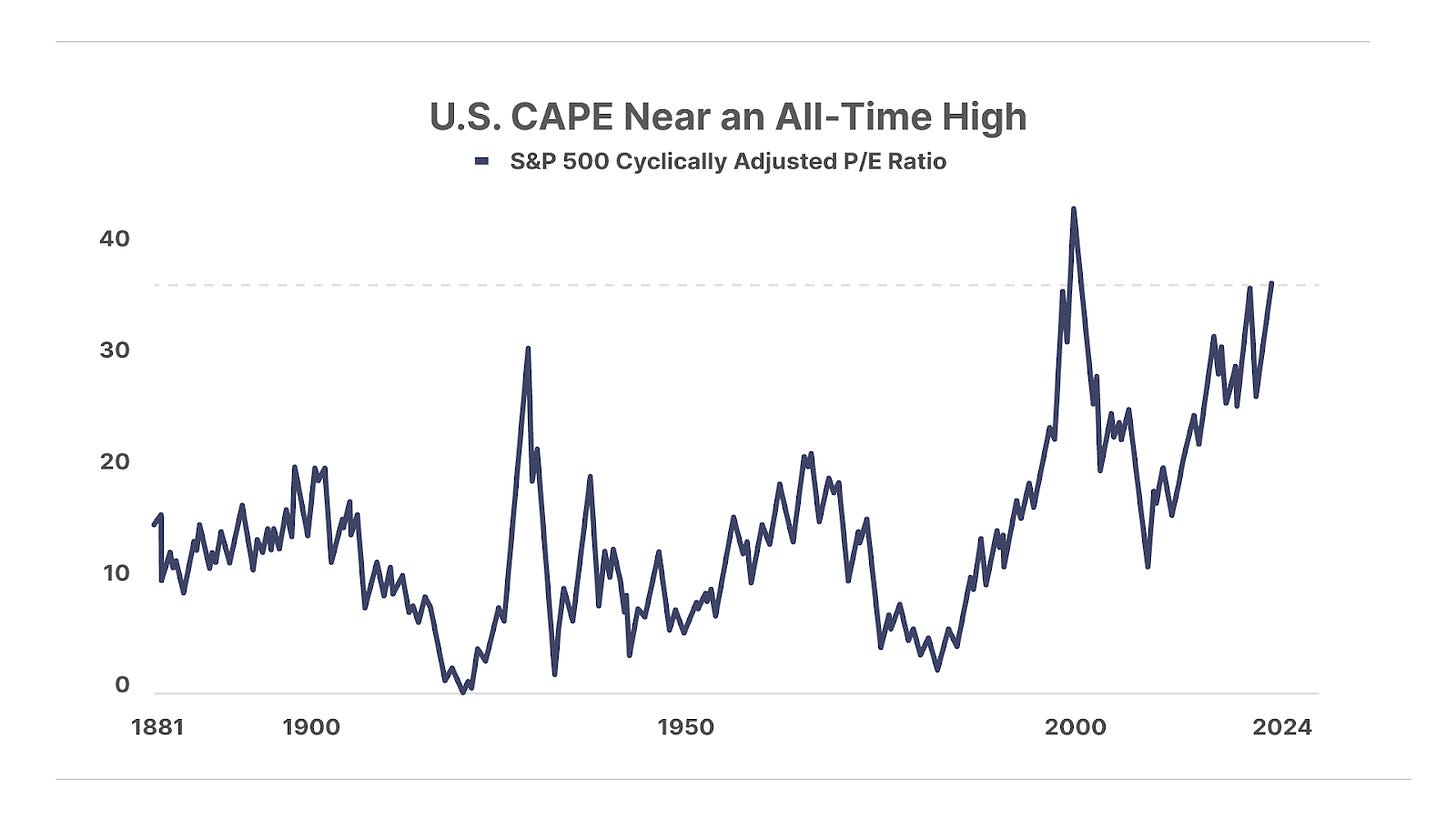
2. Price-to-earnings near an all-time high. The S&P 500’s CAPE, which averages about 16, just crossed above 38, for just the third time since the 1880s… which means stocks have not been this pricey in nearly 150 years. The cyclically adjusted price-to-earnings (CAPE) ratio smooths earnings volatility by taking a 10-year average – rather than the single-year earnings snapshot of the standard P/E ratio. Meanwhile, the CAPE for Brazil’s stock market is around 11… Hong Kong, 12… Japan, 22. Might be time to raise some cash… See below.
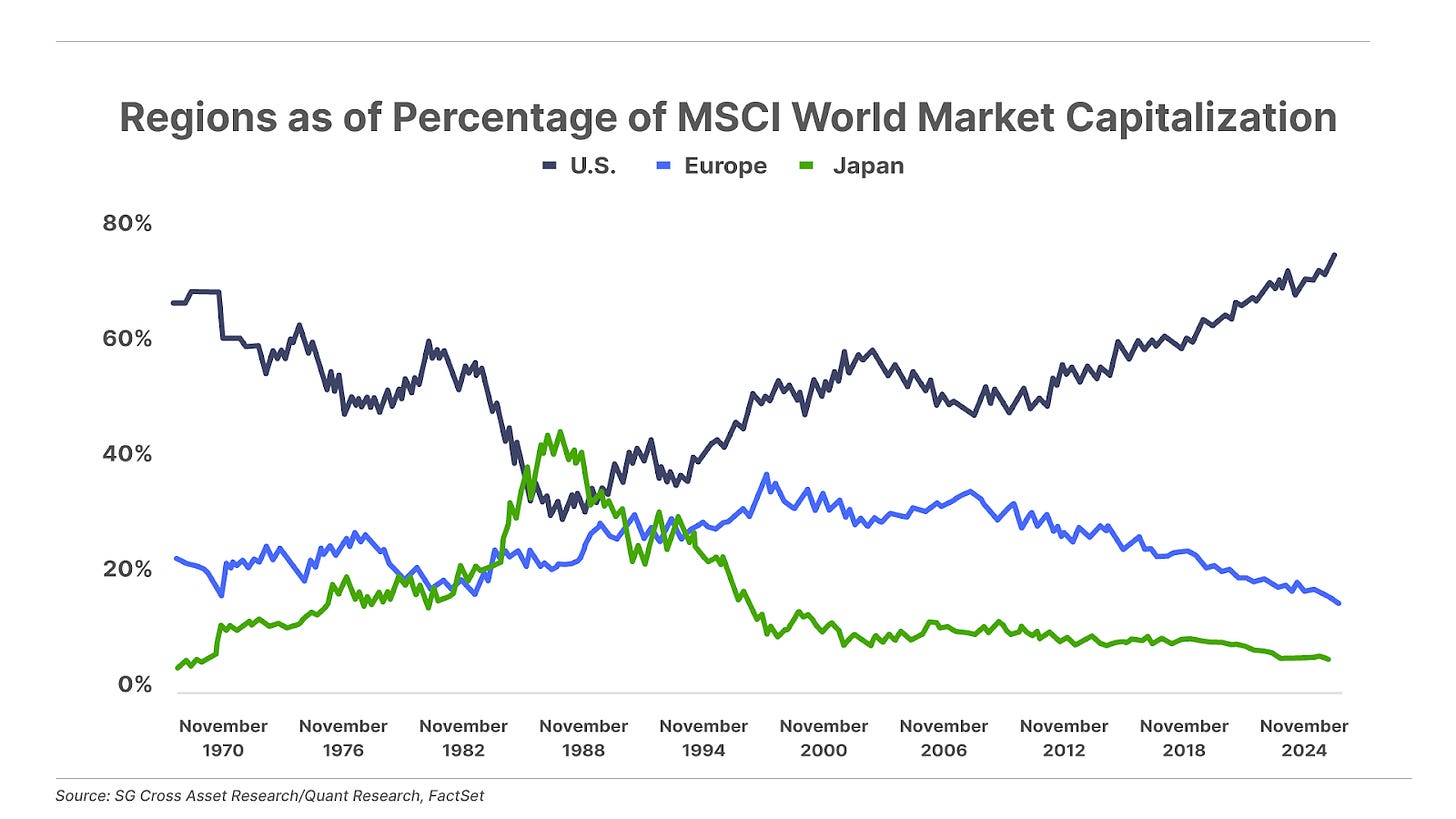
3. U.S. share of global stock markets hits another high… A few decades ago, the market cap of Japan was greater than that of the U.S., and Europe’s was close. That’s completely changed: Today, the U.S. stock market accounts for 74% (an all-time high) of the MSCI World Index – a reflection of a multi-decade period of outperformance of U.S. markets relative to the rest of the world. Over the past decade, the S&P 500 is up 253%... Japan, 170%... and Europe’s STOXX Total Market index, 109%. How much longer will that last?
And one more thing… With the recent move higher in long-term interest rates, the Equity Risk Premium (“ERP”) is threatening to flip negative. The ERP – the 12-month forward-earnings yield on the S&P 500 minus the yield on the 10-year Treasury note – represents the extra yield investors receive for holding volatile stocks rather than less-risky government bonds. Usually positive (with a long-term average of around 4%), a negative ERP indicates that investors are actually paying to take on the extra risk in equities. This is the opposite of how markets should be working. And… it’s bad news for stock prices.

Why, and How, You Should Be Raising Cash… And What to Do With It When You Do
When markets are hitting new highs, and inflation is rising, raising cash can feel like the last thing you’d want to do.
But it should be the first thing… to do right now.
As we’ve been writing most days in the Daily Journal… U.S. markets are not only at all-time highs – they’re also at all-time-high valuation levels. What’s expensive can always become more expensive… or it can also decline in price as mean reversion kicks in. And at this point, the latter is looking far more likely.
Why? For starters, the “Buffett Indicator” – Warren Buffett’s favorite valuation metric which compares the market value of the broad equity market versus U.S. gross domestic product (“GDP”) – recently reached a new all-time high of 209%. That’s more than two standard deviations above its long-term trend, and it represents the most expensive relative valuation in history – well above previous bubble peaks of 1929, 2000, and 2021. Likewise, the S&P 500’s price-to-sales ratio is within shouting distance of an all-time high, and is already higher than anytime in history outside of a few months near the peak of the meme-stock bubble in 2021.
Despite record-high valuations, investors have never been more bullish. U.S. households are effectively “all in” on the stock market, with the highest allocation – at 48% – to stocks as a percentage of total financial assets in history… and more Americans than ever – 51.4% – expect even higher stock prices over the next year. Many professional investors are apparently just as exuberant, with hedge funds borrowing a record $2.5 trillion to buy stocks and futures traders holding the largest position in equities on record.
And of course, this is all happening against a backdrop of recessionary signals in the labor market, burgeoning stress in corporate and consumer debt, and political uncertainty around the impact of President-elect Donald Trump’s anticipated new policies.
The benchmark – the “previous extremes” that a lot of these comparisons stem from – are markets in 2007-2009.
In case you don’t remember… Between October 2007 and March 2009, the S&P 500 fell 58%, representing one of the worst declines in U.S. markets ever.
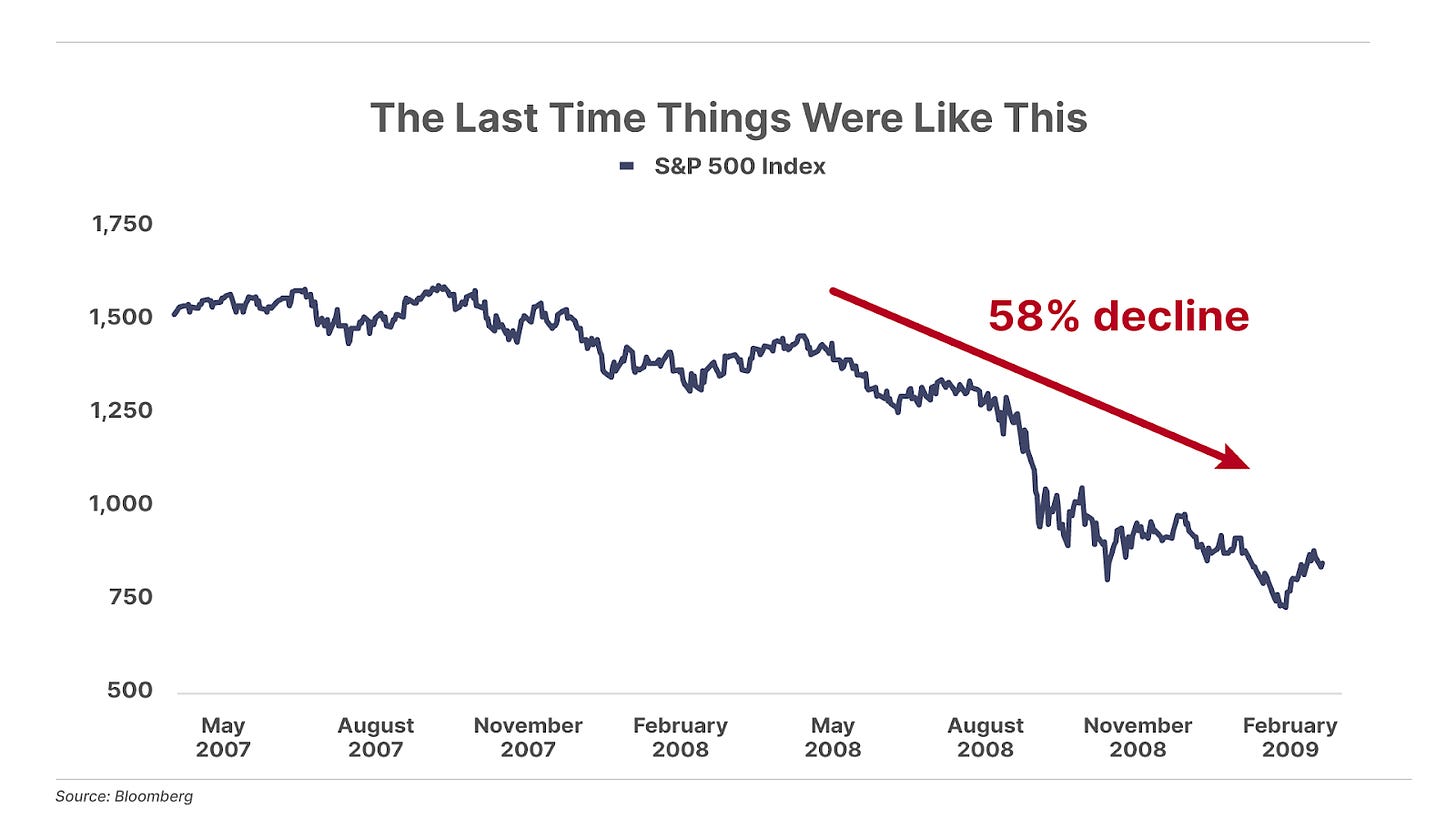
Yet even this figure doesn’t fully describe the pain most investors experienced. Many individual stocks plunged much more – including those of some of the highest-quality, capital efficient companies we love here at Porter & Co.
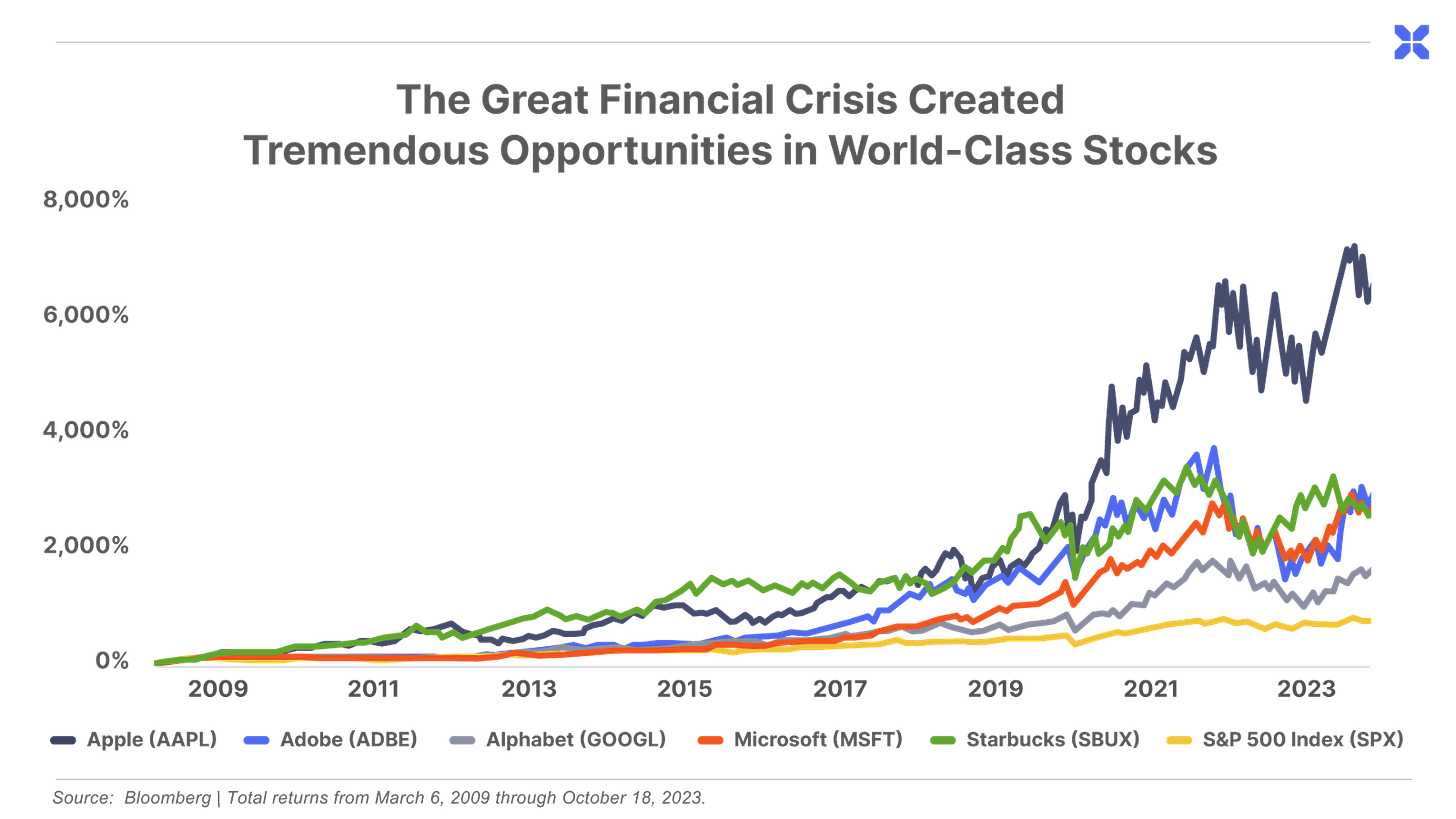
Notable examples include Microsoft (MSFT), which fell 60%, Apple (AAPL), down 62%, Google (GOOG), down 67%, Adobe (ADBE) down 68%, and Starbucks (SBUX), which fell a gut-wrenching 83% peak to trough.
These declines scarred a generation of investors, leading many to swear off stocks for years.
However, like other notorious bear markets, the Global Financial Crisis also created generational opportunities in these very same stocks. Each of them briefly traded at historically low valuations, far below their long-term average price-to-earnings (P/E) multiples.
For example, in early 2009, investors had the opportunity to buy shares of Microsoft for as little as eight times earnings, versus its long-term average valuation well above 20 (and today’s P/E of 35).
Those who did buy Microsoft shares could’ve earned total returns of 2,800% – or more than 27 times their money – to date. That represents an annualized return of 26% on Microsoft.
Similarly, investors could’ve purchased shares of Google for 16 times earnings (up 1,600% to date, or 22% annualized), Starbucks for 11 times earnings (up 2,700%, or 26% annualized), Adobe for 10 times earnings (up 3,100%, or 27% annualized), and Apple for 11 times earnings (up 6,700%, or 33% annualized).
For comparison, the S&P 500 returned 740%, or 16% annualized, over the same period – which is actually well above its long-term annualized return of around 10%.
These are life-changing rates of return on par with the greatest investors in history.
Of course, taking advantage of these kinds of opportunities is easier said than done.
It requires more than just the discipline to buy when most investors are selling – to “be greedy when others are fearful,” as Warren Buffett famously said. You must also have the cash available to do so.
Unfortunately, most folks tend to remain fully invested until a market collapse or economic crisis is already underway… and only begin to raise cash in earnest after stocks have suffered significant declines.
This behavior is doubly harmful. It locks in big losses on the stocks you sell too late. And it leaves you with relatively little capital to take advantage of new opportunities (assuming you aren’t too traumatized to get back in).
The key to avoiding this fate is to raise cash before real trouble begins. And, with plenty of economic and financial uncertainty ahead – all-time high valuations in U.S. equity markets, “sticky” inflation, and rising long-term interest rates – now is a great time to do so.
If you don’t already hold a meaningful portion of your portfolio in cash, consider raising some soon. (Porter’s Permanent Portfolio currently recommends a 25% cash allocation.)
The cash you hold today is what is needed to earn Buffett-like returns of 20% to 30% annually, with very little risk, for years, even decades, when the next crisis comes.
How to Raise Cash
The first step is to take a close look at every position you own and ask one simple question: “Am I comfortable holding this asset through a financial panic?”
If the answer is not a resounding “yes,” the decision is easy: sell and raise cash now.
Pay particular attention to speculative stocks and companies with significant debt burdens that are likely to struggle under tighter financial conditions. These kinds of companies are likely to decline the most in value in any crisis, and in some cases may not survive at all.
For many investors, simply ridding your portfolio of riskier stocks may be sufficient. However, if you have a large percentage of your portfolio in equities you may need to do more.
In this case, you might also consider selling even lower-risk stocks that have performed poorly since purchasing them. These stocks are likely to continue to underperform in a crisis, and selling them now could allow you to harvest tax losses that can be used to offset gains in other investments.
As a general rule, this does not apply to “forever stocks” – particularly those previously purchased at bargain prices or those with large unrealized gains.
When you’ve invested in a high-quality business capable of producing a good return on your capital, selling is almost always a mistake. Doing so may – depending on your purchase price – trigger taxable gains, and you aren’t certain to get the chance to buy back in at a better price.
That said, if you must sell these stocks, you would be wise to focus on those trading at inflated valuations. That’s because even the best businesses can generate poor returns when they’re extremely overpriced.
How to Hold Cash
Here in the U.S., “cash” generally refers to the U.S. dollar, either held as physical bills or as deposits at a bank or other financial institution.
However, it can also refer to “cash equivalents” like money-market funds and short-term debt like U.S. Treasury bills.
For years, these various forms of cash were basically interchangeable. When the Federal Reserve slashed interest rates to near zero following the Global Financial Crisis, the yields available in traditional bank accounts, money-market funds, and Treasury bills all dropped to virtually nothing.
But that began to change in 2022 as the Fed aggressively hiked interest rates.
Today, even after the Fed’s recent rate cuts, U.S. Treasury bills offer real yields above the official inflation rate (and nominal yields of up to 4.6%). For the first time in 15 years, investors placing funds in these vehicles are no longer penalized for holding cash.
This makes T-bills – particularly those maturing in 90 days or less – an ideal place to hold cash today.
The best way to buy T-bills is from the government itself, through its TreasuryDirect website. While the website is a bit clunky, this is the safest way to own T-bills, especially if you’re holding a substantial amount of cash.
If you’d rather not deal with the hassle of buying T-bills through TreasuryDirect – or you want to hold them in an IRA or other tax-advantaged account – there are a couple of “next best” alternatives.
One option is purchasing T-bills through your brokerage account. Most major brokers – including Fidelity, Vanguard, Charles Schwab, and TD Ameritrade – allow you to buy newly issued T-bills with no fees.
However, it’s worth noting that the minimum purchase through a brokerage is typically $1,000, versus a $100 minimum through TreasuryDirect. This option also carries a small degree of counterparty risk (via your brokerage), so it’s a good idea to keep balances below the $500,000 SIPC limit per account. (The Securities Investor Protection Corporation guards against the loss of securities and cash at troubled financial institutions.)
Another option is getting exposure to T-bills through an exchange-traded fund (“ETF”), such as the iShares 0-3 Month Treasury Bond ETF (SGOV) or the SPDR Bloomberg 1-3 Month T-Bill ETF (BIL).
These funds are the most convenient way to own T-bills. However, they do charge a small annual fee (currently 0.09% and 0.14%, respectively). Like all ETFs, these funds also technically carry a small risk of capital loss. So it would be wise not to hold all your cash in a single fund if you choose this path.
(Note: You might also consider a short-term Treasury note ETF, such as the iShares 1-3 Year Treasury Bond ETF (SHY). These funds have a bit more duration risk – meaning they’re a little more sensitive to changes in interest rates – but they may also offer higher yield than T-bill funds).
Money-market funds are also an option. Many funds are currently paying yields at or near those of short-term Treasuries.
However, like ETFs, money-market funds often charge annual fees and carry some risk of capital loss. In addition, some of these funds may invest in riskier debt obligations outside of the Treasury market.
In this case, investors should be sure to look for lower-cost funds that are invested primarily in short-term U.S. Treasuries, such as the Vanguard Treasury Money Market Fund (VUSXX).
And again, it’s never wise to put all your eggs in this one basket.
Finally, a handful of online banks and financial companies – such as SoFi, Discover, and Marcus by Goldman Sachs – offer savings accounts yielding 4% or more. While these yields may lag T-bills, they’re still well above those available at most banks.
Given the potential risks to the banking system, short-term Treasuries are generally preferable to these accounts. But if you do decide to hold cash in one of these banks, be sure to keep your balances within the $250,000 FDIC account limit.
How to Protect Your Cash
It's great that investors can now earn a real yield on their cash for the first time in years. However, the U.S. dollar – like all fiat currencies – is guaranteed to lose purchasing power over the long term. And inflation of course eats away at your cash… so you don’t want to hold cash indefinitely.
To protect against inflation and the decline of the dollar, it’s prudent to hold a small portion of your cash in physical gold bullion and Bitcoin.
You don’t need a lot… putting just 5% to 10% of your cash in gold and 1% to 5% in Bitcoin is plenty to protect you from the loss of value in your cash over time, while allowing you to patiently wait for the next generational buying opportunity in the world’s best businesses. (In Porter’s Permanent Portfolio, we recommend a 25% allocation to Bitcoin and gold.) You can learn more about the benefits of owning gold and Bitcoin here.
Another alternative, particularly for investors eager to get out of stocks but who are wary of the impact of inflation on their cash, is distressed bonds. The beauty of bonds is that while they may rise and fall in price, you can be fairly certain that you’ll ultimately be paid back at par – and be paid interest in the meantime. “Junk” bonds have a reputation of being risky and volatile… but chosen correctly, they’re exactly the opposite. Porter & Co.’s Distressed Investing portfolio has nine open bond positions, with seven of them in the black (up an average of 12%)... closed positions are up an average of 19%. Lead analyst Marty Fridson also recommends the shares of companies in distress… on three stock positions he’s up an average of 86%, and he’s releasing a new recommendation in the next issue of Distressed Investing, which is coming out tomorrow. To learn about why the looming economic environment will be an optimal one for distressed investing, click here… or call 888-610-8895 or internationally at +1 443-815-4447 to speak with Lance James, our Director of Customer Care.)
Good investing,
Porter Stansberry,
Stevenson, MD
P.S. We think it’s time to raise cash. But: Not everyone feels that way. And markets that are high can – as we’ve seen – continue to move higher.
And if you’re looking for new ideas about where to put cash – again, if you think it’s the right time – Jeff Brown would be a great place to start.
He’s one of the best stock pickers I’ve ever worked with, and he’s a bona fide prophet when it comes to understanding what’s next in tech.
He got his subscribers into Bitcoin in 2015… Nvidia in 2016… and AMD in 2017.
The results… Bitcoin is up 26,613%… Nvidia, 10,422%… AMD, 1,229%.
And if you want to find out more about Jeff’s research (at a substantial discount to his normal prices) and get his future recommendations, go here now.
